Login or register now to maximize your savings and access profile information, order history, tracking, shopping lists, and more.
Our Customer Service team is available from 8am to 6:00pm, ET, Monday through Friday. Live chat is available from 8am to 5:30pm ET, Monday-Friday.
We serve educators in more than 170 countries worldwide. Create a quote request on our website or contact our International Sales Team.
Login or register now to maximize your savings and access profile information, order history, tracking, shopping lists, and more.
Your Shopping Cart is currently empty. Use Quick Order or Search to quickly add items to your order!
Grades 6–8. Unit Highlight—Will tomorrow's blizzard warrant a shutdown of schools and businesses or be a minor inconvenience? How do we know? Applying what they already know about weather and climate to the interaction of the Earth, oceans, and the atmosphere, students study storms, winds, hurricanes, and tornadoes. They model the water cycle, the collision of air masses to visualize these effects. Students design a solution to minimize the impact of a storm surge. By the end of the unit, students use data sets to predict the weather and make evidence-based claims.
From the STC3 Edition, Weather and Climate Systems addresses the performance expectations, and attendant science and engineering practices and crosscutting concepts, deemed appropriate for grades 6 through 8 by the Next Generation Science Standards® (NGSS).
Each lesson in this unit builds on the skills and concepts presented in previous lessons. As students progress through the unit, they take increasing responsibility for their own learning. Eventually, students plan and conduct their own procedures, and they analyze the results obtained. Therefore, the unit should be taught in its entirety; it should not be used as a sourcebook of occasional experiments.
To structure and scaffold the development of students' knowledge, skills, and cognitive reasoning, this unit includes 3 primary lesson types: pre-assessment, skills and knowledge building, and assessment. The pre-assessment lesson allows educators to access students' preconceptions, misconceptions, and skills. The skills and knowledge-building lessons provide multiple opportunities for students to grow and learn through formative assessment. The assessment lesson includes both performance and written assessment activities that function together as a summative assessment of student learning.
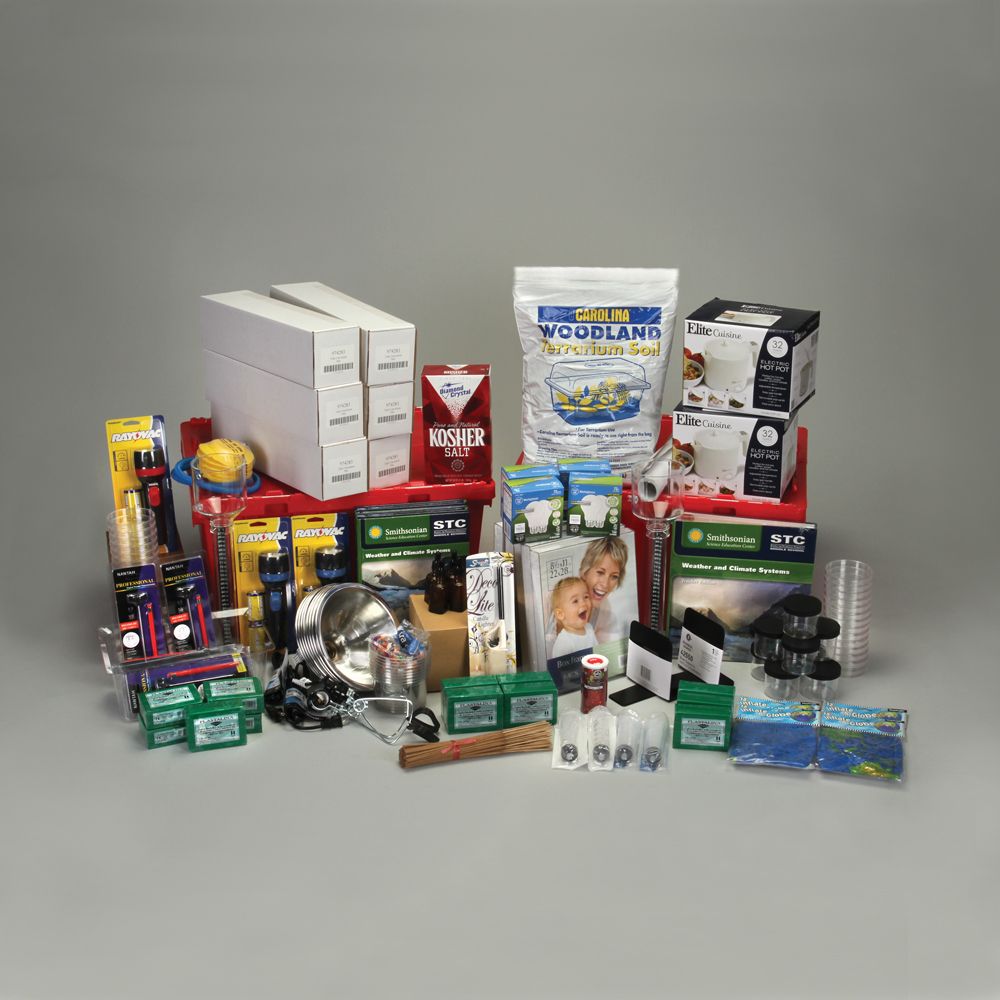
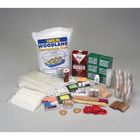
This 5-Class Unit Kit comes with a Teacher Edition, teacher access to Carolinascienceonline.com, 16 reusable hardbound Student Guides (item #513103), student eBook access, and the materials needed for a teacher to teach up to 5 classes of 32 students per day.
Next Generation Science Standards®
Performance Expectations
Disciplinary Core Ideas
Science and Engineering Practices
Crosscutting Concepts
Lesson Summaries
Lesson 1: Pre-Assessment
Lesson 1 serves as a pre-unit assessment of students' ideas about atmospheric and oceanic weather events and processes. In Investigation 1.1, students first create a concept map, brainstorming what they know about these events and processes. Then, in Investigation 1.2, using a map and an inflatable globe, they focus on physical features of Earth's surface and on patterns of cloud cover. They try to identify areas in which hurricanes, tornadoes, ice melt, droughts, and floods occur. Students consolidate and record their observations on a world map, and then they share their observations with the class. In addition, in Investigation 1.3, students create KWL charts to identify what they know, what they want to know, and what they learned about the topic. They will return to their concept and world maps and KWL charts at different points during the unit.
Lesson 2:
Students consider what drives weather as it relates to uneven heating on Earth, the generation of air currents, and possible storm formation. In this lesson, students use thermometers, beakers of soil and water, and a lamp as a source of radiant energy during Investigation 2.1 to investigate the warming and cooling rates of equal volumes of soil and water. Then, in Investigation 2.2, students graph and analyze the collected data. These investigations prepare students for later lessons that will apply their knowledge of the uneven heating and cooling of Earth's surfaces to differences in the temperatures of air masses and the formation of air currents.
Lesson 3:
Students investigate how the temperature of Earth's surface affects the temperature and movement of air above it. They then relate this information to the formation of air masses and clouds and to the movement of moisture through the water cycle. In Investigation 3.1, students find out how water temperature affects evaporation and condensation. In Investigation 3.2, they model the water cycle. Investigation 3.3 finds students using Convection Tubes™ to determine the effect that the temperature of a surface has on the temperature of the air above it. Finally, in Investigation 3.4, students use smoke inside Convection Tubes™ to observe how the temperature of a surface affects the movement of air above it. These investigations prepare students for later lessons in which they apply their knowledge to the formation of air masses, air currents, and clouds and their effects on weather.
Lesson 4:
Students will plan and carry out different controlled experiments to investigate the relationship between air pressure and weather. In Investigation 4.1, students will collect data to examine what happens when different air masses meet. They will make predictions and then carry out an experiment to test those predictions. In Investigation 4.2, students will explore how different air pressures will affect cloud formation by designing and planning an investigation. In Investigations 4.3 and 4.4, students will construct their own barometers and use them to measure air pressure. Students will compare their data to determine trends related to air pressure and weather.
Lesson 5:
Students explore the conditions under which the ocean gains and loses heat energy and develops two kinds of (ultimately) heat-driven currents: surface currents and deep currents. Students are introduced to the ocean as a reservoir and transporter of heat. They also study ways in which ocean currents move heat around the globe. The lesson begins as students investigate how Earth's shape and orientation to the Sun result in uneven heating of its surfaces. Then, over the course of three investigations, students explore the effects of water's fluctuating density and the wind on ocean currents. In Investigation 5.1, they determine how temperature affects currents. Then they discover the role that salinity plays in driving the ocean's movements in Investigation 5.2. Finally, students explore surface currents in Investigation 5.3 to see how wind impacts ocean currents.
Lesson 6:
Students learn what conditions are necessary for the formation of storms, particularly the vortices known as hurricanes and tornadoes. Students begin by studying satellite images and drawing the parts of a hurricane. During Investigation 6.1, students use a model made with two connected bottles filled with water and glitter to simulate and observe a vortex. They apply their observations of the model to the movement of air in a tornado or hurricane and develop a definition of the word “vortex.” By the end of Lesson 6, students will demonstrate an understanding of how vortices form and behave.
Lesson 7:
Students begin their work with weather maps and weather predictions. During Investigation 7.1, students begin a five-day project that includes collecting daily weather data, observing clouds, looking for patterns and relationships in the data, and attempting to predict the weather by using any relationships observed in the data. Some of the data collection will need to be done as homework. In Investigation 7.2, students apply their observations to weather maps and draw conclusions about the conditions under which clouds and storms form and move. In Investigation 7.3—conducted after students have had ample time to collect weather data—students analyze and graph their weather data and note any patterns they can find. Then, students share the results of their weather data project with the class and construct scientific explanations about using current weather data to make predictions.
Lesson 8:
Students explore the impacts of severe storms and how the storms are predicted. Students investigate hurricane effects of these storms on coastal populations. Students explore how coastal landforms affect flooding by modeling a storm surge in Investigation 8.1. They analyze and interpret data about Hurricane Katrina, including its wind speed, latitudinal and longitudinal position, and atmospheric pressure in Investigation 8.2. Students also design a building with features to protect it from storms and learn how technology is used to gather tornado data in Investigation 8.3.
Lesson 9:
Students begin their work with weather data and climate zone predictions. During Investigation 9.1, students analyze weather data for five different cities, looking for patterns and relationships in the data and attempting to predict in which climate zone each city is located based on the data. Then, students review their work with climate zones with their class, explaining their choices and using data to support their choices. Students also learn about different ecosystems and read about other factors that are important in determining the climate of a particular region.
Lesson 10:
Students explore the data scientists collect related to climate change. Students have been exposed to the uncertainty scientists face in collecting and interpreting data, and they are beginning to develop a sense of what it means to make tentative statements of fact based on data that is imperfect and fragmentary but intelligently collected and analyzed. Students explore these concepts by measuring the temperature in an area and then finding a way to represent the data with a single value. Next, students are presented with and discuss how and why different types of data are collected as evidence of climate change. Each group is assigned or selects a graph of climate data to analyze and interpret. Students engage in research aimed at a deeper, more contextualized understanding of what the graph means, how its data has been collected, and why the subject under study is important. Then, in Investigation 10.2, students present their research to the class, allowing the whole class to get familiar with different pieces of climate change research.
Lesson 11:
Students analyze the impact of climate change, explore how scientists project trends to predict the future, and explore how scientists simulate future conditions and monitor effects. Students recall what they have learned in previous lessons about climate change and consider how scientists make climate predictions. In Investigation 11.1, students look forward 100 years using the United States Global Change Research Program (USGCRP) report, Global Climate Change Impacts in the United States (2014), and explore temperature and precipitation projections for their area. These projections do not have the certainty of predictions, but they will give students a sense of what climatologists expect for their region. The projections also introduce practical issues of climate change that regional planners, health officials, farmers, engineers, and others must consider. In Investigation 11.2, students learn how researchers at the Smithsonian Environmental Research Center simulate higher CO2 and nitrogen levels and sea level rise expected in the future to monitor their effects on wetlands.
Lesson 12: Assessment
The unit concludes with a 2-part assessment: the Performance Assessment and the Written Assessment. In the Performance Assessment, students apply the knowledge and skills they have acquired during the unit to analyze data in order to predict future weather conditions. In the Written Assessment, students respond to multiple-choice and constructed-response items aligned to concepts covered in this unit.
If for any reason you are not satisfied with this item, it is eligible for a return, exchange, refund, or credit up to 180 days from date of purchase. Restrictions may apply. Returns & Exchanges Policy.