My Cart
Your Shopping Cart is currently empty. Use Quick Order or Search to quickly add items to your order!
Next Generation Science Standards:
BIG IDEA 4: SYSTEMS INTERACTIONS- Biological systems interact, and these systems and their interactions exhibit complex properties. All biological systems comprise parts that interact with one another. These interactions result in characteristics and emergent properties not found in the individual parts alone. All biological systems from the molecular level to the ecosystem level exhibit properties of biocomplexity and diversity. These two properties provide robustness to biological systems, enabling greater resiliency and flexibility to tolerate and respond to changes in the environment.
Unit 8: Ecology
8.3: Population Ecology
8.6: Biodiversity
Big Idea 2: Interactions Between Earth Systems-
The Earth is one interconnected system. Natural systems change over time and space. Biogeochemical systems vary in ability to recover from disturbances.
Unit 2: The Living World: Biodiversity
2.1: Introduction to Biodiversity
Biodiversity is a hot topic. In the wild, habitats are shrinking and species are becoming extinct—lost forever—some without humans even discovering them. Biodiversity is also an issue closer to home. Planting large fields of a single genotype crop (e.g., corn or wheat) can make food sources vulnerable if that genotype becomes susceptible to a new pest or drought. An entire crop can be lost. In contrast, wild populations are more genetically diverse, so some individuals usually survive adverse conditions.
When studying the biodiversity of a community, a simple survey of the number of different species (species richness) in an area seemingly would give a clear picture of the diversity. As the following example illustrates, a calculation of the species richness alone doesn’t give that clear picture. It’s not until the distribution of those species (also called species evenness) is added to the calculation that the biodiversity of a community is more accurately portrayed.
Looking at the 2 communities below, compare the species richness and the species diversity using the Simpson’s Diversity Index. Note: For this activity, we will assume that each different morphotype of insect collected represents a species.
| Community A | Community B | ||
|---|---|---|---|
| Morphotype 1 | 1,000 | Morphotype 1 | 400 |
| Morphotype 2 | 100 | Morphotype 2 | 400 |
| Morphotype 3 | 100 | Morphotype 3 | 400 |
Species richness (R) is based solely on the number of species (or morphotypes) found in a given area and does not reflect the relative dominance of any species. The formula for species richness is:
R = s
Where s = the number of morphotypes
So for the example of the communities above, species richness is
RA = 3
RB = 3
Simpson’s Index is one of the simplest calculations that takes into account species evenness within a community. Simpson’s Index (D) is dependent on the number of species and their relative dominance. It indicates the probability that both organisms in a randomly drawn pair are from different species. The formula is:
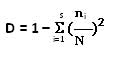
Where
s = the number of species (morphotypes)
i = a given morphotype
ni = the number of individuals of morphotype i
N = the total number of individuals collected (for all morphotypes)
D will equal 0 for a community with a single taxon (with no possibility of individuals being from different species) and will approach 1 as diversity is maximized.
| For Community A | For Community B |
|---|---|
| s = 3 | s = 3 |
| n1 = 1000 | n1 = 400 |
| n2 = 100 | n2 = 400 |
| n3 = 100 | n3 = 400 |
| DA = 1 – [(1,000/1,200)2 + (100/1,200)2+ (100/1,200)2] | DB = 1 – [(400/1,200)2 + (400/1,200)2+ (400/1,200)2] |
| DA = 0.292 | DB = 0.667 |
This activity is appropriate for a class of 32 students working in groups of 8.
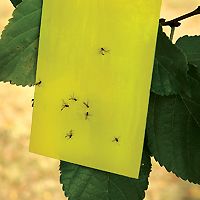
Sticky trap preparation and installation 30 min
Insect trapping At least 1 hr (can leave traps in place overnight)
Insect collection 30 min
Analysis of data 30 min
Use caution when collecting living samples since they can include harmful organisms.
Note: This activity is best done when there isn’t a lot of air moving. Wind can dislodge sticky traps. Figure 1 Example Data Table of Morphotypes (using class-designated names)
Figure 2 Sample Data Table
Procedure (students)
Note: Wait at least 1 hour or, if necessary, until the next class period.
# of Morphotypes (s)
Morphotypes (i)
ni
(ni/N)
(ni/N)2
1
Red spotted
2
Black speckled
3
Green lacy winged
4
Tiny black
s=4
Totals ( ):
N=
Simpson=1 –
Simpson=
# of Morphotypes (s)
Morphotypes (i)
ni
(ni/N)
(ni/N)2
1
Red spotted
3
0.333
0.111
2
Black speckled
4
0.444
0.198
3
Green lacy winged
1
0.111
0.012
4
Tiny black
1
0.111
0.012
s=4
Totals ( ):
N=
9
Simpson=1 –
0.333
Simpson=
0.667