My Cart
Your Shopping Cart is currently empty. Use Quick Order or Search to quickly add items to your order!
By Chuck Roser
Retired Chemistry Instructor, North Carolina School of Science and Mathematics
As you heat a solid to its melting temperature, the average kinetic energy (KE) of its molecules and its temperature increase. As the solid melts, a phase change occurs and the molecules store the energy being added as increased potential energy (PE). The heat is used to overcome some of the intermolecular forces between the molecules so the molecules are free to move around each other. The temperature remains constant during the phase change.
Heating the liquid to its boiling temperature increases the average KE and temperature. As the liquid boils, PE increases as the remaining intermolecular forces are overcome. The temperature remains constant during the second phase change. Once this phase change is complete, additional energy heats the vapor to a final temperature. A typical heating diagram is shown below (Fig. 1) with the y-axis representing increasing temperature and the x-axis sample-heating time. The plateau regions represent the melting and boiling temperatures.
The time required to complete each part of the heating process depends on the amount of heat that must be absorbed and the rate at which the heat source supplies energy to the sample (J/sec). The heat absorbed for each part of this transition of solid t-butanol to vapor can be calculated as follows:
| Q = heat | m = mass | c = specific heat | ΔT = change in temperature |
Heating the solid to its melting temperature:
| Q1 = (mass in g)(csolid)(ΔT) | ΔT = Tfinal – Tinitial |
Melting the solid:
| Q2 = (moles)(ΔH°fusion) | No temperature change occurs. |
Heating the liquid to its boiling point:
| Q3 = (mass in g)(cliquid)(ΔT) | ΔT = Tfinal – Tinitial |
Boiling the liquid at its boiling temperature:
| Q4 = (moles)(ΔH°vaporization) | No temperature change occurs. |
Heating the gas/vapor to its final temperature:
| Q5 = (mass in g)(cgas)(ΔT) | ΔT = Tfinal – Tinitial |
The total heat requirement for all 5 events is Qtotal:
Qtotal = Q1 + Q2 + Q3 + Q4 + Q5
The CRC Handbook of Chemistry and Physics provides the following data on t-butanol:
Density of liquid t-butanol is 0.789 g/mL at ≅25° C
ΔH°fusion = 6.71 kJ/mol
ΔH°vaporization = 39.1 kJ/mol
csolid = 2.30 J/g °C
cliquid = 3.35 J/g °C
cgas = 1.93 J/g °C
The structure of t-butanol is 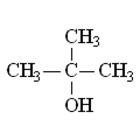
In this experiment, you will take temperature readings every 30 seconds (s) from the boiling point to below the freezing point, construct a cooling diagram of temperature vs time, estimate the boiling and freezing points, and calculate the heat released for parts of the cooling diagram.
The following materials are for a class of 20 students working in pairs.
The handbook values for t-butanol are: boiling point, 83.0° C, and melting point, 25.5° C. Compare your results to those values.