My Cart
Your Shopping Cart is currently empty. Use Quick Order or Search to quickly add items to your order!

In this introductory lab, students collect data and then devise methods to organize and display the data to give it more meaning. First, they count the stripes on sunflower seeds and sort them by number of stripes. Then, they place the sorted seeds into plastic tubes. This allows students to see and study the relative number of seeds in each category. After brainstorming and evaluating their methodologies, they graph the data and perform a written analysis of their results. Students can perform this series of activities in pairs or in groups of 4, and there are numerous opportunities for class discussion.
11 transparent, narrow plastic tubes
11 plastic or paper cups for each group
permanent markers
The ideal plastic tubes for this activity measure approximately 25 mm in diameter and 30 cm in height (1” × 12”). Carolina’s Drosophila culture vials (173120), which measure 30 mm in diameter and 10 cm in height (1 ¼” × 4”), also work well—but you may have to stack one on top of another for higher seed counts. Small, transparent plastic cups will suffice, but the result is more dramatic (and data analysis is accomplished more readily) if the containers are relatively narrow and have straight sides, giving emphasis to the difference in number in each category.
Optional Materials
magnifiers, 3× or higher, to help in observing the seeds
Ensure that students understand and adhere to safe laboratory practices when performing any activity in the classroom or lab. Demonstrate the protocol for correctly using the instruments and materials necessary to complete the activities, and emphasize the importance of proper usage. Use personal protective equipment such as safety glasses or goggles, gloves, and aprons when appropriate. Model proper laboratory safety practices for your students and require them to adhere to all laboratory safety rules.
Students should never put the seeds in their mouths.
Prepare a cup with sunflower seeds for each pair or group of 4. The exact number of seeds is not crucial, but try to allocate about 30 seeds for each student in each group. Keep in mind that students will be counting the number of stripes on each seed, so allow plenty of time for this process. For shorter (e.g., 45-minute) class periods, you might wish to conduct the brainstorming and planning activities on Day 1, followed by data collection and analysis on Day 2; alternatively, have students do their brainstorming and data collection on Day 1, and data analysis on Day 2. Students can graph their data as a take-home assignment, if desired. Students’ graphs should be titled, have both axes labeled, and include a scale of values. The data set students will collect is ideal for display as a bar graph.
Provide each pair or group with a copy of the Student LabSheet for this activity, a previously prepared cup of sunflower seeds, 11 empty paper or plastic cups, at least one magnifier, and a permanent marker. Have students number their cups and then sort the seeds by number of stripes.
Number the transparent plastic tubes according to the number of stripes on the sunflower seeds (the default being 1–11). Place these tubes at a central “data analysis station” so students can add their sorted seeds to the appropriate tubes. After all the seeds have been sorted into the tubes and students have completed the data table on their Student LabSheet, have a class discussion about how best to order the tubes to give the most meaning to the data. Ask questions that will focus students’ attention on the fact that there are numerous ways to describe and organize data. Suggestions include:
Some may argue for ordering the tubes from least to most seeds. Others may argue for ordering the tubes by number of stripes; when ordered in this way, the numbers of seeds in the tubes sometimes approximate a bellshaped curve. Accept other suggestions, also, as long as the student can provide a logical rationale for the method. Arrange the tubes in accordance with each suggestion. As you do so, ask students, “What does this arrangement tell you about the seeds and their stripes?” Students should soon realize that different arrangements of the tubes provide different information about their data set.
After the discussion, have students create a bar graph depicting their data, and then write a paragraph summarizing what their graph tells them about the data set they collected.
Optional: If students have access to electronic spreadsheet graphing software, they can enter class totals and use the program to generate their graph. Advanced students can calculate the variance of the data and even a standard deviation. If desired, you can extend the activity by having students collect and analyze data on other topics, for example, students’ height, favorite color, or type of family pet.
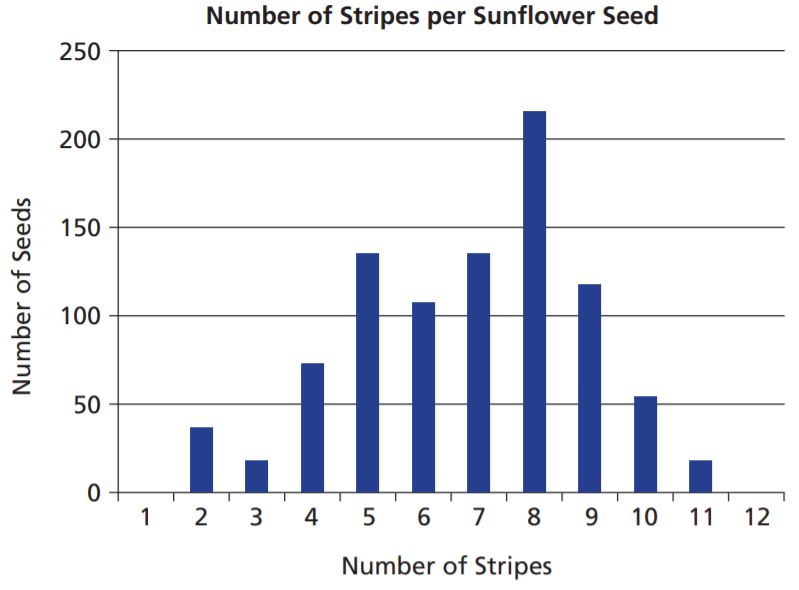
Notice that in the sample data set given below there are no seeds with 1 stripe, a common occurrence, and that there are some seeds with 11 stripes.
Sample Data Table
| Number of Stripes on Seed | Group Totals | Class Totals |
| 1 | 0 | 0 |
| 2 | 3 | 36 |
| 3 | 4 | 18 |
| 4 | 9 | 72 |
| 5 | 10 | 135 |
| 6 | 14 | 108 |
| 7 | 12 | 135 |
| 8 | 24 | 216 |
| 9 | 10 | 117 |
| 10 | 4 | 54 |
| 11 | 2 | 18 |
| Total Number of Seeds Counted | 92 | 909 |
Sample answers have been provided.
Method 1
| Order the tubes (data) by | the number of seeds in the group, from lowest to highest. |
| Advantages | This method shows the range of the number of seeds with each number of stripes. |
| Disadvantages | It does not visually represent the number of stripes on the seeds, a central criterion of the data set. |
Method 2
| Order the tubes (data) by | the number of stripes, from 0 to 11. |
| Advantages | This method makes it easy to see which numbers of stripes are more common and which are less common. |
| Disadvantages | It does not show the range of the number of seeds in each group. |
Sample Graph