My Cart
Your Shopping Cart is currently empty. Use Quick Order or Search to quickly add items to your order!

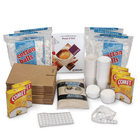
Physical Science Recommended for grades 9–12.

Teacher Prep: 30 min
Student Activity: 30-60 min
depending on the number of groups (data for a total of 30 trials should be recorded)
 Safety Gloves Required
 Safety Goggles Required
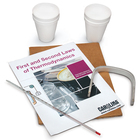
You come into class and your chair seat is warm, warmer than the classroom itself. What do you need to know to explain this phenomenon?
How can the energy that flows into and out of a system be modeled mathematically?
HS-PS3-1. Create a computational model to calculate the change in the energy of one component in a system when the change in energy of the other component(s) and energy flows into and out of the system are known.
Prepare 1,000 mL beakers with warm and cold water. The warm water should be 50 to 70° C and the cold water 5 to 15° C. Students can add tap water to the warm and cold beaker water to alter initial temperatures.
Student data will vary with the amount of water and initial temperatures. In every case, the warmer water should cool (-ΔT), and the cooler water should warm (+ΔT).
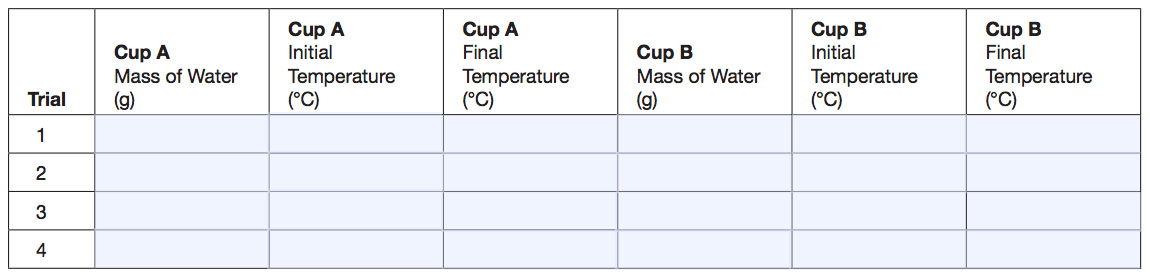


Record all calculations in a table.
Using the class data table, calculate the change in temperature (ΔT) for cups A and B. ΔT is calculated Tfinal—Tinitial. One cup will have a —ΔT.
Be certain there are at least 30 data points in the class data table. Actual student data will vary.
Using class data and the ΔT calculations from above, calculate the ratio of ΔTA : ΔTB for every trial. Record the ratio as a decimal number rounded to the tenths place.
Actual student data will vary.
Using class data, calculate the ratio of MassA: MassB for every trial. Round to the tenths place.
Actual student data will vary.
Graph the ratio of masses to the ratio of temperature change.
Draw the line of best fit and calculate the slope of the line.
The line of best fit should be a straight line with an origin of 0,0.
The line should go through 0,0. Determine the equation for the line. Remember that you graphed ratios.
Use the format Y = mX + b
Y = ΔTA /ΔTB
X = MA /MB
Slope = ~1
b = 0
—ΔTA/ΔTB = 1(MA/MB) + 0 or —ΔTA/ΔTB = MA/MB
Rewrite and interpret the equation of the line so data from cup A is on one side of the equal sign and data from cup B is on the other side. Remember that you graphed ratios. This is the mathematical model.
—ΔTA/MA = ΔTB /MB
This equation shows that the ratio of a positive change in temperature to mass is equal to the negative ratio of temperature to mass. This demonstrates the Law of Conservation of Energy by showing that thermal energy gained by substance B (+ΔT), equals thermal energy lost (-ΔT) by substance A.
How is temperature related to kinetic energy?
Kinetic energy and temperature are directly related. As kinetic energy of particles increases, temperature increases. The inverse is also true.
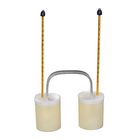
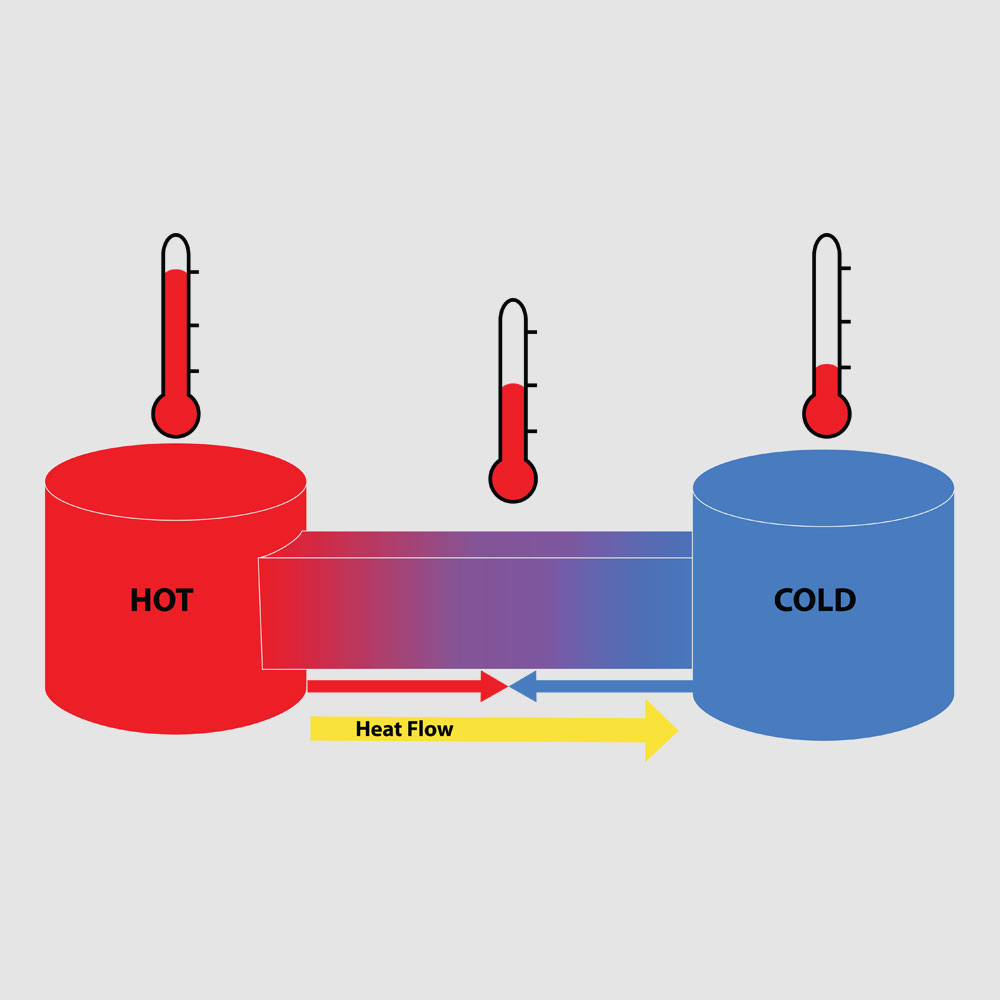
Use your data to explain how the aluminum bar transfers energy between cups.
The particles in the higher temperature substance in cup A have more kinetic energy than the particles in the aluminum bar. As the particles collide with the bar, they transfer energy to the bar. Since the particles in substance A are transferring thermal kinetic energy to the bar, substance A cools off.
Thermal kinetic energy is transferred through collisions between particles in the bar, which makes the temperature of the bar greater than the temperature of the substance in cup B. As particles in substance B collide with the bar, the thermal kinetic energy from the bar is transferred to substance B. This process continues until the Al bar and the substance in both cups A and B, obtain the same temperature, (reach thermal equilibrium).
Use your data to explain how the equation in item 7 above relates to the law of conservation of energy.
Thermal kinetic energy is conserved. The energy “lost” from the substance in cup A was “gained” by the substance in cup B (heat gained = heat lost).
How would the mathematical model change if the substances in cups A and B were not the same?
If the substances in cups A and B were not the same, the slope of the line would probably not be 1. One substance may require more heat energy to change its temperature by 1° C than the other substance. This is the concept of heat capacity. The slope of the line would reflect the ratio of heat capacities of the substances being used.
Use the law of conservation of energy and heat transfer to explain the warm seat from the phenomenon.
The student who sat in the chair before I did transferred some thermal kinetic energy to the cooler chair. Thermal energy travels from warmer to cooler regions, so the chair warmed up until the person and the chair were the same temperature. When I sat down, the chair seat was warmer than I was, so thermal kinetic energy was transferred from the chair to me until the temperatures were the same.
*Next Generation Science Standards® is a registered trademark of Achieve. Neither Achieve nor the lead states and partners that developed the Next Generation Science Standards were involved in the production of, and do not endorse, these products.


 View
View