My Cart
Your Shopping Cart is currently empty. Use Quick Order or Search to quickly add items to your order!

Earth and Space Science
Recommended for grades 9-12.

Teacher Prep time: 30 min
Student Activity: 45-60 min
No PPE is required for this activity.
Teacher demonstration: Saturate a whole sheet and a half sheet of paper towel. Ask students to predict which paper towel holds the greatest volume of water. Squeeze as much water as possible from the paper towels into 2 graduated cylinders to confirm or reject their hypothesis. Ask students this question: how does the availability of stored water affect an ecosystem?
How can one change to Earth’s surface create feedback that causes changes to other systems?
HS-ESS2-2. Analyze geoscience data to make the claim that one change to Earth’s surface can create feedbacks that cause changes to other Earth systems.
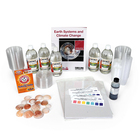
Gather materials. To save student time, you can precut the sponges. Materials may be saved for additional activities or disposed of in the trash.
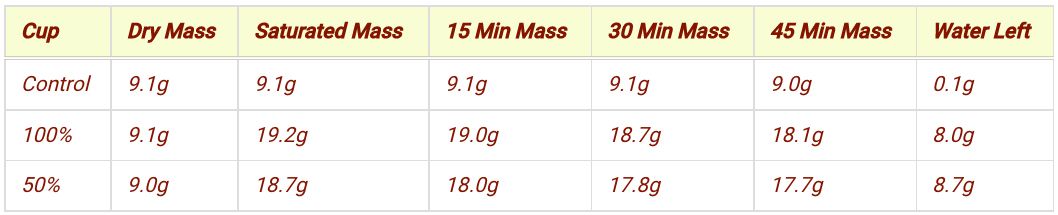
Sample data was taken outside, on a sunny day, at a temperature of 83° F.
Analysis
1. For each cup, calculate the amount of water that evaporated into the air.
Control = 0 g
100% = 1.1 g
50% = 1.0 g
2. Calculate the rate of evaporation for each cup. Rate is amount of water lost (g) per unit of time (min).
Control = .1 g/45 min = 0.002 g/min
100% = 1.1 g/45 min = 0.02 g/min
50% = 1.0 g/45 min = 0.02 g/min
The dry sponge (control) had no water added to it that could then be evaporated, but it must have had residual moisture.
3. Calculate the surface area of each sponge. Area of a circle is A = π r2.
Control and 100% saturated area = 3.14 x (2.8 cm)2 = 24.6 cm2
50% saturated area = 1/2 of 100% = 24.6/2 = 12.3 cm2
Discussion
1. Why was a saturated sponge used to represent wetlands?
A sponge absorbs, holds, and releases water just like the soils on both freshwater and estuarine wetlands.
2. Where does the process of evaporation take place within a liquid?
Evaporation only takes place at the surface of a liquid. As molecules gain kinetic energy, they reach a point where they have enough energy to escape the surface. This continues for layer after layer of molecules until all the liquid has evaporated.
3. Explain the factors that contribute to evaporation rate in a wetland?
The factors that contribute to evaporation include temperature, wind, relative humidity, and surface area. The higher the temperature, the greater the evaporation rate because molecules have more kinetic energy. Greater amounts of wind increase evaporation rate because molecules are physically removed from the surface by the wind. Once the air has reached saturation, evaporation rate lowers because the air cannot hold additional water vapor; and the greater the surface area, the more molecules there are exposed to the radiant energy of the sun and wind, so evaporation will increase.
4. Use your data to explain which wetland coverage contributed the most water vapor to the atmosphere.
From the data above, the 100%coverage wetland contributed the greatest mass of water vapor to the atmosphere—1.1 g compared to 1.0 g for the 50% coverage.
5. Compare the mass of water evaporated to the surface area of the sponges. Explain any differences.
100% coverage = 1.1g/24.6 cm2 = 0.045 g/cm2
50% coverage = 1.0g/12.3 cm2 = 0.081 g/cm2
6. Compare wetland coverage and evaporation rate.
The rate of evaporation was the same for the 100% and 50% coverage cups. Since both cups were placed in the same conditions of temperature, wind, and relative humidity, and the size of the wetland was very small compared to a natural setting, this result is not surprising. However, with the evaporation rate being the same, the sponge (wetland) with the least amount of water should completely dry out first. Neither sponge was left long enough to dry completely.
7. What would you predict to be the effect on a wetland ecosystem if the amount of water evaporating from the wetland decreased over time?
If the amount of water evaporating decreased, then relative humidity would decrease, possibly leading to a decrease in cloud cover and rainfall.
8. Use your data to construct a model of a feedback loop that predicts how a decrease in wetland coverage, total water vapor added to the atmosphere, evaporation rate, and rainfall are related. Identify if this is an example of a positive or negative feedback loop. Your model may be prose, a graphic, or a flow chart.
Student answers will vary but the key points in the model are:
This is an example of a negative feedback loop.
*Next Generation Science Standards® is a registered trademark of Achieve. Neither Achieve nor the lead states and partners that developed the Next Generation Science Standards were involved in the production of, and do not endorse, these products.


 View
View