My Cart
Your Shopping Cart is currently empty. Use Quick Order or Search to quickly add items to your order!
By Chuck Roser, Retired Chemistry Instructor
North Carolina School of Science and Mathematics
| Science and Engineering Practices | Disciplinary Core Ideas | Crosscutting Concepts |
| Practice: Planning and carrying out investigations Students will investigate the relationship between temperature and pressure of a closed container. |
DCI: Matter and its interactions • Students will determine the relationship between pressure and temperature and relate temperature to kinetic energy and motion of particles. |
Concept: Scale, proportion, and quantity • Students will establish a proportional relationship between temperature and pressure. |
This experiment’s objectives are to (a) observe the relationship between the pressure and temperature of a constant number of moles of gas in a constant volume container, and (b) to experimentally determine an estimated value for absolute zero.
When a gas is heated, its molecules’ average speed and kinetic energy are increased. If the container has a constant volume, the molecules will strike its sides with greater frequency. This creates greater force on the container’s walls per unit area, increasing pressure in the container. It is one of the bases for the warning against heating an aerosol spray can.
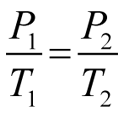
A graph may be plotted to show how the pressure of a fixed mass of gas varies as the temperature is changed. The temperature at which the pressure of an ideal gas would, in theory, reach zero can be determined by extrapolating the pressure vs. temperature graph to zero pressure. This temperature is referred to as absolute zero and is the zero point for the Kelvin temperature scale. An extrapolation to zero pressure is necessary because real gases condense to liquids and solidify before reaching absolute zero. The relationship between the pressure of an ideal gas and its Kelvin temperature is expressed in Gay-Lussac’s law:

In this experiment, the pressure within the Absolute Zero Demonstrator apparatus is measured at several different temperatures. A graph of pressure vs. temperature is then prepared to establish the relationship between pressure and temperature and to estimate a value for absolute zero. The apparatus consists of a copper bulb having a fixed volume (copper expands and contracts only slightly with temperature), a pressure gauge, and a fixed mass of gas. Gas pressure is measured with the pressure gauge. Before a measurement is taken, the apparatus is allowed to equilibrate to ensure that the gas and bulb are at the same temperature.
| Reading No. | Type of Bath Used | Temperature (°C) | Temperature (°K) | Pressure (mm Hg) |
| 1 | ||||
| 2 | ||||
| 3 | ||||
| 4 | ||||
| 5 | ||||
| 6 |
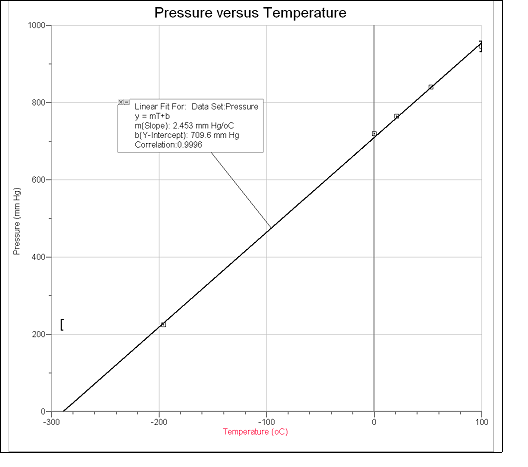
Attach a graph of pressure vs. temperature in °C. This graph should have labeled axes with units as follows: scale the x-axis from –300 to 100° C (or a value negative enough to clearly show the x-intercept) and the y-axis from 0 to 1,000 mm Hg. Show the linear regression line through your data with the slope, y-intercept, and correlation factor.
| Reading No. | Type of Bath Used | Temperature (°C) | Temperature (°K) | Pressure (mm Hg) |
| 1 | Boiling water | 100.0 | 373.1 | 945 |
| 2 | Boiling water + room temp. water | 53.0 | 326.1 | 840 |
| 3 | Room temp. water | 21.0 | 294.1 | 765 |
| 4 | Ice water | 0.0 | 273.1 | 720 |
| 5 | Dry ice/ethanol (or acetone) | –78.5 | ||
| 6 | Liquid nitrogen | –195.7 | 77.4 | 225 |
