Solar Cell Misconceptions
Mike Isley
Product Developer
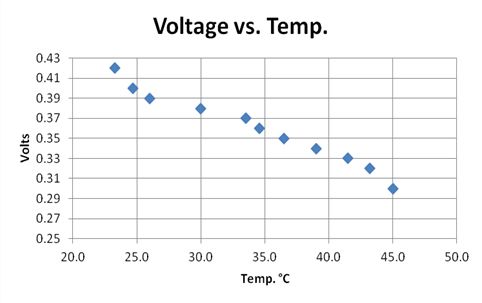
All of your students have seen photovoltaic solar cells used in a variety of ways; however, students may have misconceptions in understanding what influences solar cell output. One survey of middle school students indicated that they knew a solar cell required light to generate electricity, but most thought it was heat that created energy and that solar cells produce more energy on a hot day than a cold day.1 Actually, solar cells are less efficient as the temperature of the cells rises above 25° C (77° F). This activity explores how ambient temperature and the angle of illumination can affect solar cell output in volts.
Background
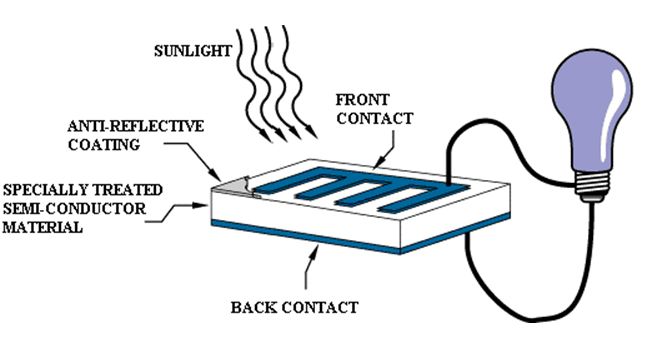
A typical solar cell is composed of a specially treated semiconductor wafer made of silicon or similar elements (see Figure 1). This wafer is sandwiched between 2 plates, 1 positive and the other negative. When photons of light strike the semiconductor, electrons are knocked loose from atoms of the semiconductor, and they flow through a closed circuit as electric current.2 Solar cells are connected in series or parallel to make rectangular panels that produce direct current at a given voltage and amperage.

Figure 1 Typical solar cell.
Materials
For teacher demonstration or lab group of 2 to 4 students
- Flashlight (artificial sun)
- Support Stand (item #707161)
- Small Utility or Buret Clamp (item #707378)
- Digital Multimeter (item #757462)
- Graph Paper (or spreadsheet computer program with graphing)
- Digital Pocket Thermometer (item #745360)
- Solar Cell, with Leads (item #975488)
- 12" Ruler (item #702611)
- Protractor (item #114262)
- 2 Clip Leads (item #756515)
- Hair Dryer (or warm water bath [55° C])
- Clear Plastic Tray with Lid
- Aluminum Pie Pan (item #971240)
Activity 1: Best angle for optimum voltage
Procedure
- Connect the positive (red) and negative (black) wires of a solar cell to the alligator clips of 2 wire leads. Connect the opposite clips of the wire leads to the red and black probes of a multimeter, ensuring that the red wire of the solar cell is connected to the red wire of the multimeter and the black wire of the solar cell is connected to the black wire of the multimeter.
- Turn on the multimeter and select DC voltage range to measure 1 V or less.
- Hold a protractor in front of the solar cell. Place a 12" ruler in front of the protractor and hold the ruler vertically at 90°.
- Turn on a flashlight and place it behind the ruler, in line with the top of the ruler. Make sure the light shines directly on the middle of the solar cell (see Figure 2). Record the voltage reading to the nearest 0.01 V in Data Table 1.
Figure 2 Protractor in front of solar cell with 12" ruler.
- Move the ruler left to 60°, keeping it against the table surface.
- Place the flashlight at the top of the ruler; align with ruler. Make sure the light illuminates the middle of the solar cell. Record the voltage reading.
- Repeat steps 5 and 6 for angles of 40° and 20° and record the voltage.
Data Table 1
Angle (°) Voltage 90.0 60.0 40.0 20.0
- Plot a graph of the data with volts on the y-axis and angle in degrees on the x-axis.
- Based on your data, what is the ideal angle for incident sunlight?
- Based on your graph, at what angle do you begin to see a significant drop in voltage output?
Activity 2: Voltage vs. temperature
Procedure
- Place the solar cell inside the clear plastic tray. Using a single-hole punch, make a hole in the lid next to an outer edge.
- Insert both wires from the solar cell through the hole in the top of the lid. Close the lid; connect the wires to the wire leads, and the wire leads to the multimeter as you did in Activity 1.
- Turn on the multimeter and select DC voltage range to measure 1 V or less.
- Insert a digital thermometer—or a laboratory thermometer if you don’t have one—into the hole in the top of the lid.
- Place a flashlight in the jaws of a universal clamp and attach to a ring stand. Adjust the height of the flashlight to exactly 30 cm above the surface of the solar cell in the plastic tray.
- Turn on the flashlight and position it so that the light hits the center of the solar cell (see Figure 3).
Figure 3 Flashlight positioned so that light hits the center of the solar cell.
- Record the temperature in ° C and the voltage produced at that temperature in Data Table 2. This is the voltage at room temperature.
- Use a hair dryer or place the closed plastic tray in an aluminum pie pan water bath of 50 to 55° C to gradually increase the temperature. Record the temperature for each change of 0.01 V up to 45° as the flashlight illuminates the cell (see Figure 4).
Figure 4 Water bath for increasing solar temperature.
Data Table 2
Temperature (° C) Voltage
- Plot a graph of the data from Data Table 2 with volts on the y-axis and temperature on the x-axis.
- Based on your data, what is the best temperature for voltage output?
- Based on your graph, how does temperature affect solar cell output?
- Knowing that solar cell panels are mounted on roofs that often have black asphalt shingles, what recommendations would you suggest to keep voltage output at a maximum?
Activity question answers
Activity 1
- (9) Based on your data, what is the ideal angle for incident sunlight?
90°
- (10) Based on your graph, at what angle do you begin to see a significant drop in voltage output?
40°
Activity 2
- (10) Based on your data, what is the best temperature for voltage output?
Room temperature
- (11) Based on your graph, how does temperature affect solar cell output?
Inversely proportional—as the temperature increases, the voltage decreases.
- (12) Knowing that solar cell panels are mounted on roofs that often have black asphalt shingles, what recommendations would you suggest to keep voltage output at a maximum?
Mount panels a few inches above the roof to allow airflow for cooling and make panels with light-colored materials to reduce heat absorption.
Sample Data
Activity 1: Best Angle for optimum voltage
Angle (°) | Voltage |
---|---|
90.0 | 0.44 |
60.0 | 0.42 |
40.0 | 0.35 |
20.0 | 0.24 |

Activity 2: Voltage vs. temperature
Temperature (° C) | Voltage |
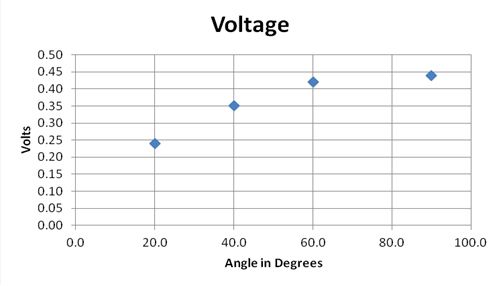
---|---|
23.3 | 0.42 |
24.7 | 0.40 |
26.0 | 0.39 |
30.0 | 0.38 |
33.5 | 0.37 |
34.6 | 0.36 |
36.5 | 0.35 |
39.0 | 0.34 |
41.5 | 0.33 |
43.2 | 0.32 |
45.0 | 0.30 |

Extension activities
- Measure the voltage for temperatures below room temperature by using an ice bath surrounding the solar cell tray.
- Calculate the % decrease in solar cell voltage output from room temperature to the highest temperature.
Example: 0.30 V highest temp – 0.42 Vroom temp ÷ 0.42 V × 100 = –29%
Footnotes
1M. Ing, M. Ward, and E Haberer. 2013. Building on students’ knowledge of solar cells. Science Scope 36 (6): 21–29.
2NASA Science News. Available at: http://science.nasa.gov/science-news/science-at-nasa/2002/solarcells. Accessed December 11, 2013.