Teaching the Scientific Method with Effervescent Tablets
By Mike Isley
Product Developer
Introduction
We innately explore, observe, question, and experiment to understand our environment. Children demonstrate this propensity at an early age by asking endless “why” and “how” questions—the genesis of a systematic process of thought and investigation referred to as the scientific method. In this simple activity, your students will learn the steps of the scientific method as they investigate the endothermic reaction of effervescent tablets dissolving in water.
Background
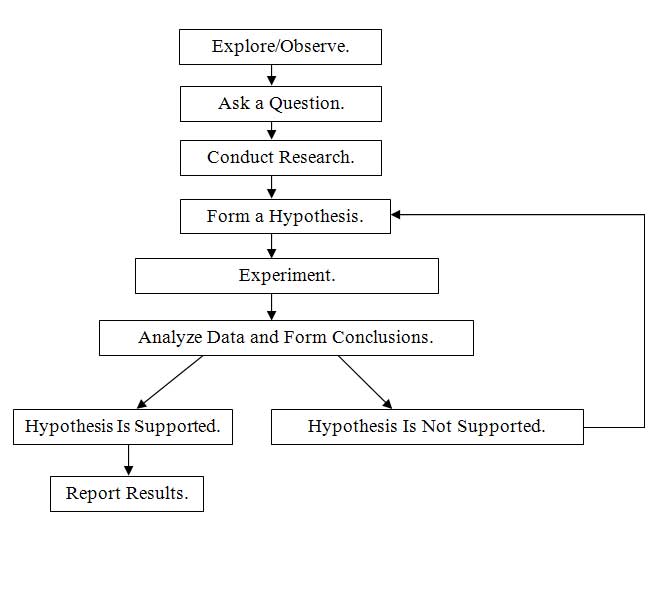
The steps of the scientific method are outlined in a flowchart below. Note the pathway for revisiting the hypothesis and creating a new one if the first one is not supported by the experiment.

Figure 1 Scientific method flowchart.
Explaining the steps of the scientific method
- Explore/observe. You may discover an interesting phenomenon while exploring or observing your environment.
- Ask a question. After observing the phenomenon, ask a question as to why or how it happens.
- Conduct research. Rather than reinventing the wheel, gather as much information as you can through Internet research, scientific journals, other people, and books to gain more knowledge about your question and how it might best be answered.
- Form a hypothesis. State a tentative explanation in a way that allows it to be tested empirically.
- Experiment. Design a protocol to control all variables except for one. This manipulated
variable is called the independent variable. The variable affected by the manipulation of the independent variable
is called the dependent variable. All other variables are held constant. These are called controlled variables.
For example, a hypothesis might state that increasing temperature will increase the rate of a reaction. The
independent variable is temperature, and the dependent variable is time. To test the effect of temperature on a
reaction rate, you must control the concentration and volume of the reactants and, if the reactants are gases,
the volume of the container. When graphing data, the independent variable is plotted on the x-axis, and the dependent
variable is plotted on the y-axis.
Note: Some experiments benefit from the use of a control experiment, often a parallel setup that uses the same materials but without manipulation of a variable. Such a control helps rule out the possibility that an observed change would have occurred regardless of the manipulation of the variable. - Analyze data and form conclusions. After collecting data, tabulate or graph them for analysis. Graphing may allow you to see a pattern in your data or the cause-and-effect relationship between the independent and dependent variables. The results may support or refute your hypothesis. If the results refute your original hypothesis, you may revise it and then test this new hypothesis. The process may become a continuous loop of testing and revising hypotheses. Note that refuting a hypothesis is not a failure but a path to further research.
- Report results. Share the results of the experiment. If the supporting evidence is important to the scientific community, it should be shared in an article or a journal. Reporting the findings in a clear way gives other scientists the opportunity to verify your results and to incorporate your findings into general scientific understanding, which may spark new research or take someone else’s research in a different direction. Ongoing attempts to clarify or falsify conclusions help move science toward more accurate explanations of natural reality.
National Science Education Standards
Physical Science
Grades 5–8
- Properties and changes of properties in matter
Grades 9–12
- Structure and properties of matter
- Chemical reactions
Science as Inquiry
Grades 5–12
- Abilities necessary to do scientific inquiry
- Understandings about scientific inquiry
Safety
Use safety glasses or goggles when conducting this investigation.
Materials
Each student group of 2 to 4 needs the following:
- 10 Alka-Seltzer® Tablets (or similar effervescent tablets)
- 4 Disposable Cups or 250-mL Beakers
- Water
- 1 Laboratory Thermometer or Temperature Probe
Procedure
Guide your students in doing the following activities.
Observation
- Place 50 mL of water from the same source in each of 4 cups or beakers. Stir the water in each with the thermometer and ensure that the water in each cup or beaker is at the same temperature. Record this as the temperature with 0 tablets.
- Place a thermometer in the water of the first container, add 1 effervescent tablet, and stir until the solution temperature remains constant.
- Record the temperature with 1 tablet.
Ask a question
Why did the temperature of the water decrease when an effervescent tablet was added?
Conduct research
If you were to do research, you would find that dissolving certain substances in water may be exothermic (releasing heat) and certain others, endothermic (absorbing heat).
Hypothesis
Because the temperature of water drops after an effervescent tablet dissolves in it, the reaction must be endothermic. Hypothesis: I think that increasing the number of tablets added to a series of identical 50-mL samples of water (from the same source and maintained at the same temperature) will decrease the temperature of each solution by an amount proportional to the number of tablets added.
Experiment
Following the process you used with 1 tablet in the first container, you will add tablets to a container, stir while measuring the temperature until it remains constant, and then record the reading.
- First, verify that the temperature of your remaining 3 water samples has not changed.
- Add 2 tablets to the second container, stir, monitor the temperature until it stabilizes, and then record it.
- Likewise, add 3 tablets to the third container and follow the steps.
- Add 4 tablets to the last container and follow the steps.
Number of Tablets | Temperature (°C) |
0 | 23.0 |
1 | 20.2 |
2 | 18.0 |
3 | 16.0 |
4 | 14.0 |
Figure 2 Sample data table.

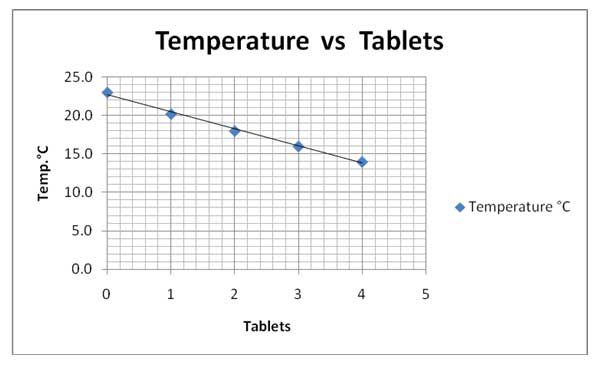
Figure 3 Sample graph: water temperature vs. number of tablets.
Data analysis and conclusions
The graph of the data supports the hypothesis. The data confirm direct relationship between the increase in number of tablets and the decrease in temperature.
Share results
Have the student groups compare their data as a class. Are there any significant discrepancies? If so, discuss possible reasons.
Student assessment
- What is the independent variable? The number of tablets.
- What is the dependent variable? The water temperature.
- What is a controlled variable in this experiment? The water volume of 50 mL is 1. (Others include same initial temperature, same water source, and the same thermometer or temperature probe.)
- How did the dependent variable respond to the independent variable? Water temperature decreased proportionally as more tablets were added.
- Based upon the trend of your graph, what would you predict as the final temperature if 5 tablets were dissolved in 50 mL of water at room temperature? 12° C.
Extension
- Get more tablets and have students test another variable. For example, the independent variable might be volume of water and the dependent variable, temperature. A controlled variable would be number of tablets (1 per trial).
- Find the slope of the temperature-versus-tablets graph to quantify the temperature decrease in degrees per tablet.
- Use a temperature probe with real-time graphing to monitor the temperatures for each trial.