Understanding the Periodic Table
By Shuana Jordan
Product Developer

Too often, students remember for a short time certain trends and properties associated with groups and periods of elements, yet come away from a study of the periodic table without really understanding or appreciating how much information the table provides.
In the following activities, students discover for themselves several trends associated with the elements on the periodic table. In Activity 1, students create an organized table from the elements’ electron configurations. Then in Activity 2, they create 3 graphs showing the relationship between elements’ atomic number, atomic radius, electronegativity, and number of valence electrons. The activities are appropriate for a class of high school students working in pairs.
These instructions are written for use with pencil and paper but could be easily modified according to the technological resources at your disposal.
National Science Education Standards
Grades 9–12
Physical Science
- Structure and Properties of Matter
Materials
- Element Lists (2 types)
- Index Cards or Blank White Paper
- Construction Paper
- Scissors
- Glue or Stapler
- Access to Graphing Software or Graph Paper
- Pencils (optional)
Preparation and procedure
- Gather all the materials needed for this activity.
- Create 2 different element lists and make enough copies for each student pair to have 1 of each:
For Element List 1, list the first 20 elements’ names, symbols, and electron configurations in random order. A portion of such a list follows:Element Name Element Symbol Electron Configuration Calcium Ca 1s22s22p63s23p64s2 Nitrogen N 1s22s22p3 Sulfur S 1s22s22p63s23p4 Figure 1 Element List 1 (sample).
- Create a central activity station where students can collect the following:
For Activity 1:
- Element List 1 (with electron configuration)
- Index Cards or Blank White Paper
- Construction Paper
- Scissors
- Glue, Tape, or Stapler
- Element List 2 (with atomic number, atomic radius, electronegativity, and number of valence electrons)
- Graph Paper (unless they have access to graphing software)
- Pencils (optional)
- Divide your class into pairs.
- Explain to students that in Activity 1 they are to create an organized table, from the information in Element List 1, on the basis of a trend or pattern they see in the elements’ electron configuration.
- In Activity 2, have students examine Element List 2 and create 3 graphs, each showing the relationship between the elements’ atomic numbers and a different feature: atomic radius, electronegativity, and number of valence electrons. Have students place atomic number on the x-axis in each of these graphs and to label them clearly for ease of interpretation. Note: For the graph with valence electrons, students should use only the first 20 elements.
- From their graphs in Activity 2, have students identify any trends for each data set. Define and identify for students a group and a period on the periodic table. Ask students to determine trends for a group and a period.
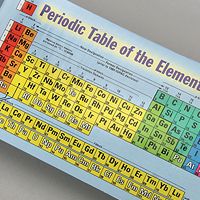
- Display a complete periodic table, and follow these activities with an in-depth discussion of the discovery of trends and the creation of the periodic table.
Discussion and extension
- As part of your discussion, relate the organized table from Activity 1 to the number of valence electrons.
- When introducing the concept of ions and chemical bonding, have students revisit their organized tables showing electron configuration to help them understand the number of electrons involved in a chemical reaction.
- Have students research specific groups of elements and identify their common properties.