My Cart
Your Shopping Cart is currently empty. Use Quick Order or Search to quickly add items to your order!
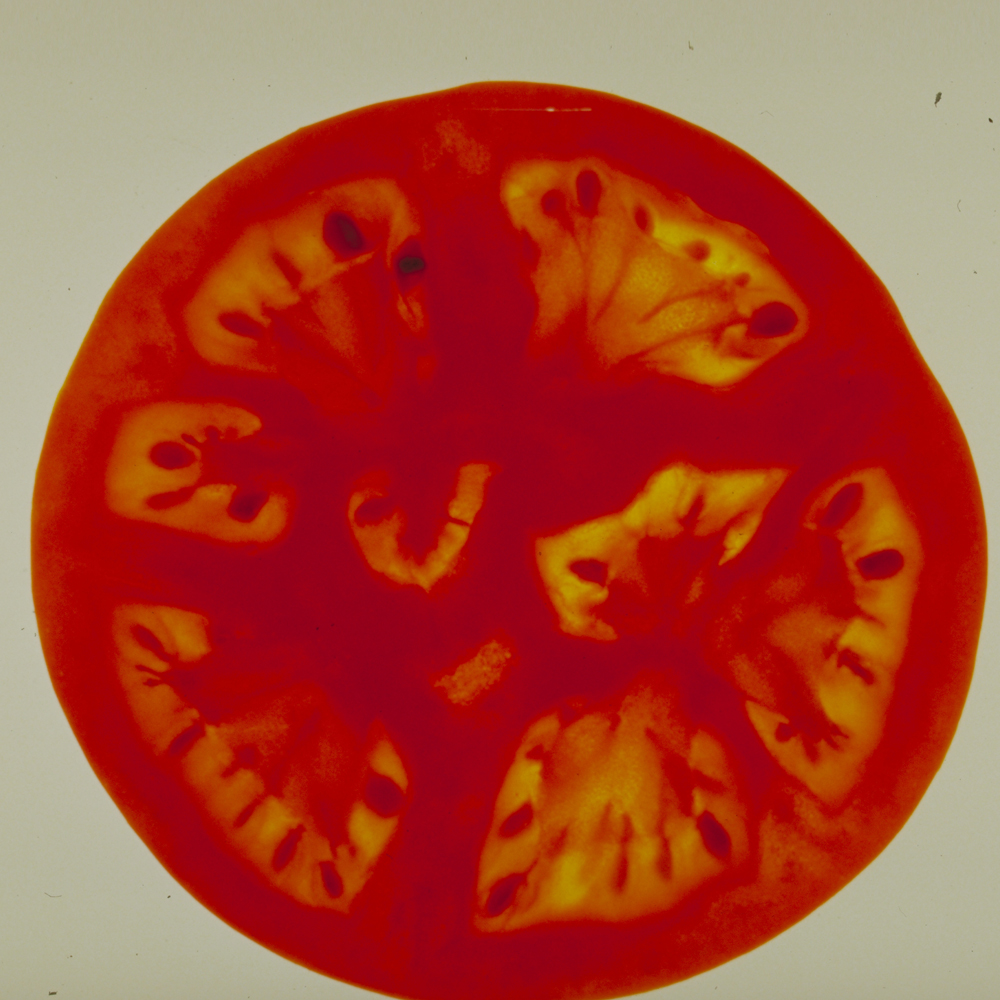
From a study of either soybean seedlings or tomato seedlings, students determine that the color alleles involved exhibit incomplete dominance, that the seedlings are segregating in a ratio of 1 green:2 yellow-green:1 yellow, and that the parent plant was yellow-green and heterozygous.
Soybean seed (178200) or Tomato seed (178670)
Seed Starter Kit (158050) or the following
Carolina® Springwater (132450)
Collecting Bucket (706230) for mixing soil and water
Plant Light Bank (158999) or greenhouse
The planting flats should be at least 15 cm × 15 cm (6ʺ × 6ʺ). Three hundred to 500 seeds are needed to approximate the expected phenotype ratios.
Ensure that students understand and adhere to safe laboratory practices when performing any activity in the classroom or lab. Demonstrate the protocol for correctly using the instruments and materials necessary to complete the activities, and emphasize the importance of proper usage. Use personal protective equipment such as safety glasses or goggles, gloves, and aprons when appropriate. Model proper laboratory safety practices for your students and require them to adhere to all laboratory safety rules.
Students can work individually or in groups. Each group will need seeds to plant. The number will depend on the size of the planting flats. Monitor students as they plant the seeds. It is best to use a deep container that will hold a layer of potting soil at least 6 cm (2 ½ʺ) deep; this allows for uninhibited growth of the roots. Deeper is better. A clear plastic cover or plastic bag will prevent the potting soil from drying out during germination.
Most bagged potting soils will be dry. Put dry potting soil into a bucket or other large container, and stir in some water. If the potting soil becomes muck, you have added too much water; add more dry potting soil. Pinch a sample between your thumb and index finger. The potting soil should remain in a cohesive clump when you release the pressure, but no water should drip.
Once the seeds are planted, the flats should go under a light bank. Set up the light bank and test it to be certain it works properly. You can use our Plant Light Bank or you can make your own light bank using three shop lights. Use fluorescent lights, because incandescent lights emit too much heat and will damage or kill the seedlings. Flats should go under the light bank within 48 hours of planting. The lights can be left on for the duration of the seedlings’ growth.
The flats can go into a greenhouse, if one is available, but if they will be in direct sunlight, plastic bags or covers should not be used and the flats should be watered daily as much as needed.
Seedlings should appear in 5 to 8 days, at which time the plastic bags can be discarded. From this time on, students should observe their flats daily for the appearance of phenotypic characteristics and check to see if their flats need watering. Seedling counts can be made 10 to 15 days after planting.
If three phenotypes are not clearly visible, there is not enough light. Either lower the lights to about 8 cm above the seedlings, or lower. Alternatively, transfer the flats to direct sunlight for just a few hours. Caution: If you delay too long, the yellow seedlings will die, leaving only the green and yellow-green seedlings.
Students can continue to grow the seedlings; they will find that yellow is a lethal trait for the plants. The yellow plants are devoid of chlorophyll, and will die after they exhaust the food stored in their cotyledons. Although our “Investigating a Lethal Trait” LabSheet is designed for use with our 177130 Green:Albino Corn, it can be adapted for use the with soybean seed (178200) as well as tomato seed (178670).
This exercise also can be used to contrast complete and incomplete dominance, if conducted in conjunction with those described on our “Seedling Genetics (Corn)” LabSheet.
Chi-square analysis is not included as part of the activity, but it can easily be added. Remember that degrees of freedom equals the number of classes minus 1. Because there are 3 phenotype classes, the degrees of freedom value is 2. There are several Internet sites that will perform the calculation from input data.
Here is a chi-square calculation based on sample data for the cross that is studied in this LabSheet.
| Phenotype | Green | Yellow-Green | Yellow | Totals |
| Actual Number (Count) | a1 110 |
a2 209 |
a3 90 |
409 |
| Expected Number | e1 102 |
e2 205 |
e3 102 |
409 |
| Ratio | 1 | 2 | 1 | 4 |
The expected numbers are calculated by dividing the total count (409) by the total of the phenotype ratios (4). 409/4 = 102.25 This number is multiplied successively by the numbers of the phenotype ratios to get the expected numbers, which are rounded to whole numbers.
e1 = 102.25 × 1 = 102
e2 = 102.25 × 2 = 205
e3 = 102.25 × 1 = 102
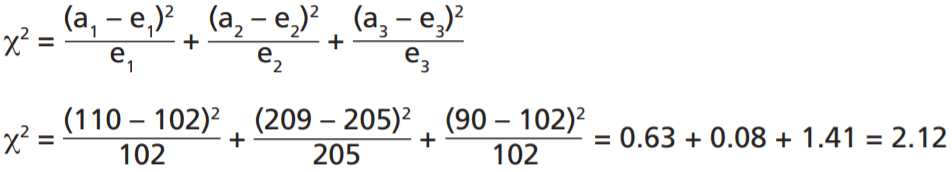
Reference to a chi-square table indicates that a deviation of 2.12 for 2 degrees of freedom gives a value between 30% and 50%. This means that our observed variation from the expected numbers would be expected to occur purely by chance more than 30 percent of the time. Such a deviation is not significant and the count obtained is evidence in favor of the expected 1:2:1 ratio. Generally, a probability of 5% is considered significant and the theoretical ratios are suspect if a chi-square value is obtained corresponding to a probability of 5% or less.