Products Suggestions:

Products suggessions:

We use cookies to provide you with a great user experience. By using our site, you accept our use of cookies . You can review our cookie and privacy policy here.

Water Pollution Awareness Demonstration

Dee Dee Whitaker
Product Content Specialist

January 2017


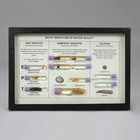
This demonstration is an engagement activity that increases students’ awareness of the current state of global water quality. Each year the United Nations releases reports on global water quality that are organized around a theme and include updated water quality data. You can take the data, turn the statements into true/false or multiple choice questions, and have a friendly class competition. This activity utilizes content from the 2013 water quality poster listed in the “Additional resources” section.


Materials (for a group of 3 to 4 students)

  • 4 Clear Plastic 8-oz Cups or 50-mL Beakers (1 per student)
  • Clean Tap Water
  • Soil, 8 oz (1 cup), in Resealable Plastic Bag (to represent sediment runoff and pollution)
  • Green Food Coloring in Dropper Bottle (to represent agricultural pollution)
  • Yellow Food Coloring in Dropper Bottle (to represent industrial waste)
  • Cocoa Powder, 2 oz (1/4 cup), or Hot Chocolate Powdered Mix Packet (to represent sewage)


Procedure (teacher prep time is 15 minutes, student time is 15 minutes)

  1. Divide students into groups of 3 or 4.
  2. Give each student a cup or beaker that is 3/4 full of clean water.
  3. Give each group soil, green and yellow food coloring, and cocoa powder/powdered hot chocolate mix.
  4. Project on a board or ask the water quality questions below and allow students to answer them.
  5. If students miss a question, they will pollute their cup of water with the type of pollution indicated in parentheses.


Student questions (correct answers are in red)

  1. What percentage of people worldwide do NOT have access to improved sources of drinking water? (add a pinch of soil)
    A. 11%
    B. 33%
    C. 55%
    D. 77%
  2. What percentage of people worldwide do NOT have access to improved sanitation? (add 3 drops of yellow food coloring)
    A. 11%
    B. 33%
    C. 55%
    D. 77%
  3. In developing countries, _______ of sewage is discharged untreated directly into water bodies. (add a pinch of cocoa/powdered hot chocolate mix)
    A. 20%
    B. 40%
    C. 60%
    D. 80%
  4. Industry dumps about _________ (metric tons) of polluted waste in water every year. (add 3 drops of yellow food coloring)
    A. 100–200 MT
    B. 300–400 MT
    C. 500–600 MT
    D. 700–800 MT
  5. The most common agricultural chemical contaminant found in groundwater aquifers is ___________. (add 3 drops of green food coloring)
    A. Ammonia
    B. Nitrate
    C. Phosphate
    D. Sulfate
  6. About how many people die each year due to inadequate water supply, sanitation, and hygiene? (add a pinch of soil)
    A. 3,500
    B. 35,000
    C. 350,000
    D. 3,500,000
  7. Which ecosystem has suffered the greatest degradation in biodiversity? (add 3 drops of green food coloring)
    A. Estuaries
    B. Fresh water
    C. Oceans
    D. Salt water marshes


Discussion

Ask students the following questions:

  1. Look inside your cup. If this represents the water quality of global fresh water, what inferences can you make about human health?
    The dirtier the water, the more health problems humans will experience.
  2. What might be some local contributions to fresh water pollution?
    Answers will vary.
  3. What can YOU do to reduce fresh water pollution?
    Answers will vary but may include conservation techniques and pollution clean-up.


Additional resources

United Nations Educational, Scientific and Cultural Organization (UNESCO) resources are updated routinely. Search for the most up-to-date information on the UNESCO Web site, en.unesco.org.


Related products