My Cart
Your Shopping Cart is currently empty. Use Quick Order or Search to quickly add items to your order!
Matthew Bostick
Product Development
February 2017
In this activity, students complete a dry lab that employs an entertaining road trip analogy. Using a few simple supplies (meter stick, string, sticky notes, and scissors), students model restriction enzyme digestion and polymerase chain reaction (PCR), then demonstrate their learning by modeling the separation of the resulting “DNA” fragments by gel electrophoresis.
Students should have prior knowledge of DNA structure and the basic function of enzymes.
Preparation: 15 minutes
Activity: 45 minutes
Scissors may cause injuries if used improperly. Ensure that students understand and adhere to safe classroom practices when performing any activity.
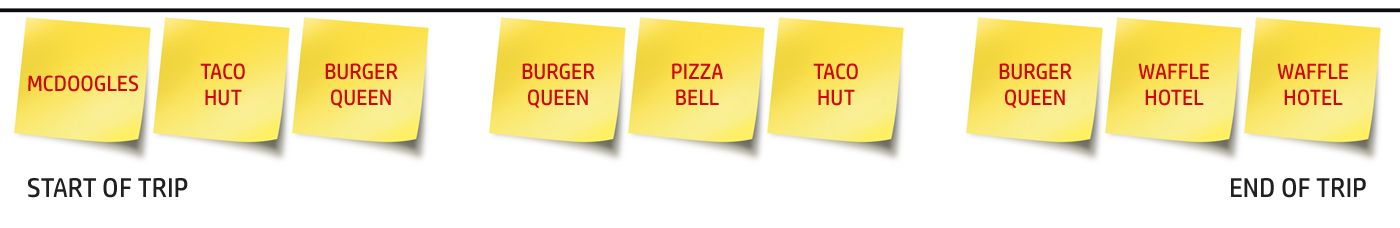
Figure 1 Example of students’ sticky notes placed randomly along their string “highway.”
We suggest the Rainbow Road Trip activity as a precursor to using advanced restriction enzyme or forensic science kits such as:
Name Student Guide
Date
Rainbow Road Trip: Introduction to
Restriction Enzymes and Gel Electrophoresis
During this activity, you will use a road trip analogy to model a genetic engineering technique that “cuts” DNA with molecular scissors known as restriction enzymes. Bacteria produce these special enzymes as a defense mechanism against any viral “foreign” DNA that may be invading the cell. These enzymes slice invading foreign DNA into fragments that are no longer functional, thus stopping the invader in its tracks.
Geneticists, medical researchers, crime scene investigation units, and evolutionary biologists may use these special enzymes to cut DNA into fragments of varying lengths. There are many different restriction enzymes and, in general, each kind cuts at highly specific sites along the DNA macromolecule. Scientists can use these fragments to answer some very interesting questions.
Considered by many to be the father of modern genetics, Augustinian monk Gregor Mendel crossbred pea plants to make some amazing scientific discoveries during the 1800s. Mendel designed experiments to study the hereditary nature of observable pea plant characteristics, such as plant height and flower color. He demonstrated that invisible “factors” within breeding organisms could produce visible traits in offspring in highly predictable ways.
We now call these “invisible factors” genes. We use biotechnology techniques to make the DNA molecule, and even the sequences of nucleotide bases (adenine, thymine, cytosine, and guanine) that code for specific genes, indirectly visible. How do scientists isolate just one specific segment of human DNA, a macromolecule that is over 3 billion base pairs long?
While Mendel inferred genetic variation within a pea plant’s phenotype, or physical expression of traits such as flower color, molecular geneticists have developed techniques that allow scientists to examine genetic variation at the level of the DNA that makes up genes. One of these techniques is known as restriction enzyme digestion. In this method, a specific region of the genome is isolated and then copied using a technique known as polymerase chain reaction, or PCR. Copies of DNA from this region may then be “cut” into fragments of different sizes using an enzyme known as a restriction enzyme.
Just as you pull over at a specific exit along a highway once you recognize the road sign of your favorite fast food restaurant, restriction enzymes recognize short and very specific sequences along a strand of DNA, and then “pull over” to cut the DNA at specific locations within those sequences. For instance, the restriction enzyme Sma1 will recognize the DNA nucleotide sequence CCCGGG and then make a cut between the cytosine and guanine nucleotides as shown in Fig. 1.
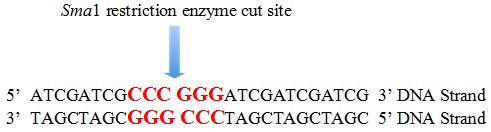
Notice that the resulting double stranded DNA fragments are now of different lengths after the cut has been made:
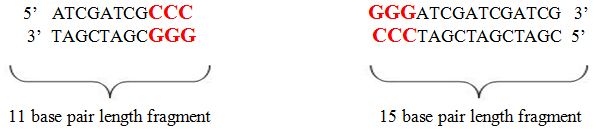
Figure 1 The restriction enzyme Sma1 will recognize the DNA nucleotide sequence CCCGGG
and then make a cut between the cytosine and guanine nucleotides.
Researchers may then separate these variable-length fragments based on their relative sizes, using a technique known as gel electrophoresis. In electrophoresis, a sample of DNA cut by a specific restriction enzyme is loaded into a well on the edge of a gelatinous medium (composed of the polysaccharide agarose). The gel along with the DNA is then placed within an electrical field. The phosphate group (PO43-) in the “backbone” of DNA is a negatively charged molecule, thus the DNA molecule carries a net negative charge. Because opposites attract, DNA fragments will “migrate” to the positive end of the electrical field.
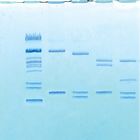
However, these variable-length DNA fragments will not migrate through the agarose “gel” at the same rate. Larger fragments of DNA, such as the 15 base pair fragment in the previous example, will diffuse through the gel medium at a much slower rate than relatively smaller fragments, such as an 11 base pair fragment. An example of gel electrophoresis of the fragments resulting from the Sma1 restriction enzyme digestion modeled above would look like the illustration in Fig. 2.
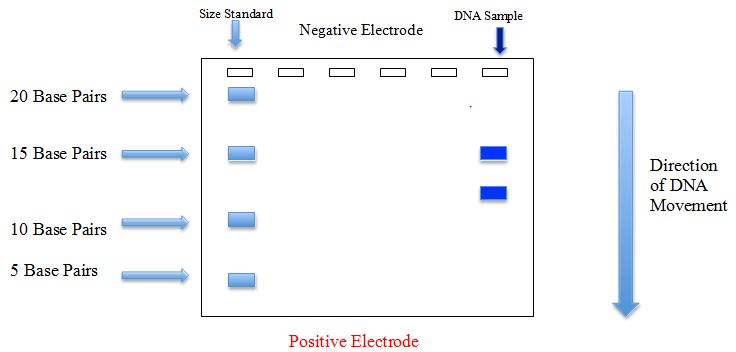
Figure 2 DNA sample cut with Sma1 restriction enzyme.
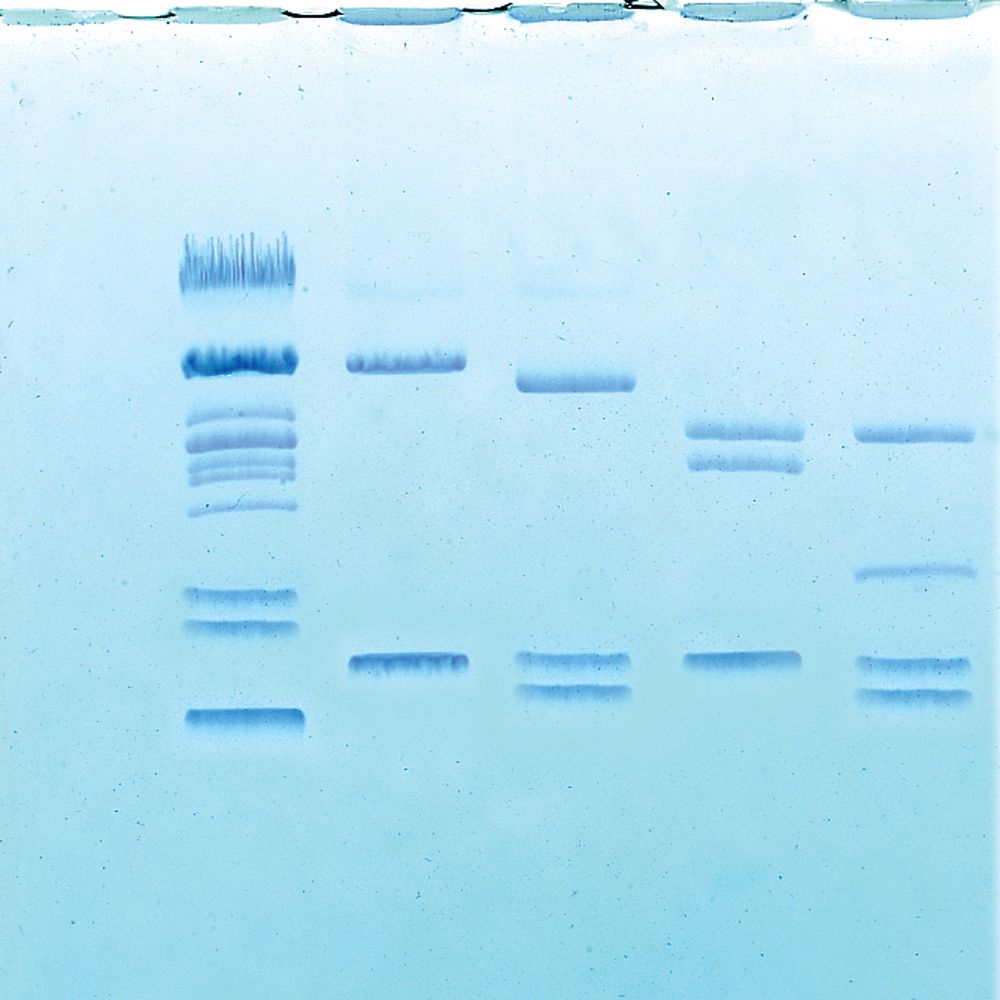
These differences in migration rate cause the fragments of DNA to separate from one another over time. Fragments of the same size collect in the same location on the gel, forming distinct bands. Typically, a “size standard,” composed of DNA fragments of known nucleotide base pair lengths, is run on the same gel as the sample, to confirm or determine the size of the DNA fragments in the samples.
The resulting patterns produced by restriction enzyme/gel electrophoresis analysis may then be useful to geneticists and evolutionary biologists for many reasons. For instance, researchers may be able to use the band patterns to detect mutations in DNA or even to determine familial relatedness among DNA samples from different individuals.
Figure 3 Example of sticky notes placed randomly along a string “highway.”
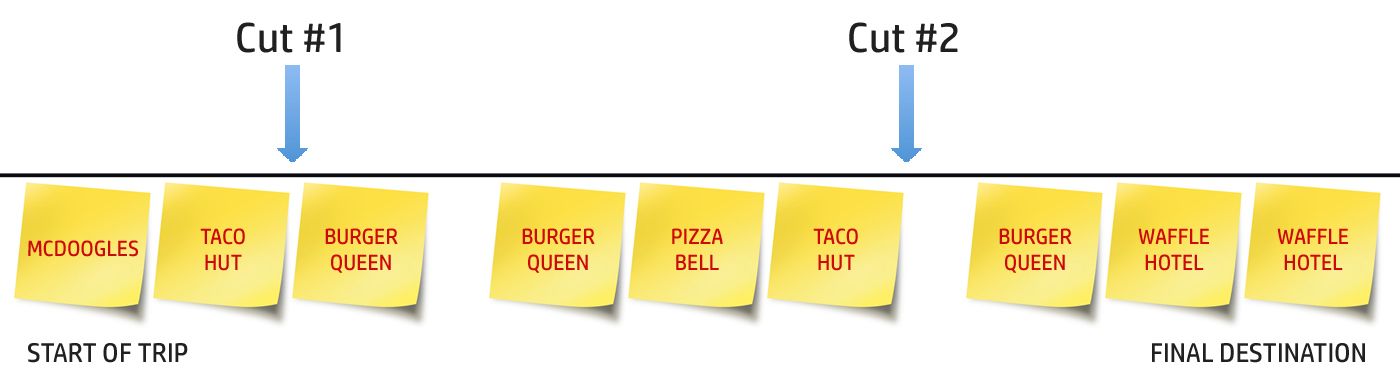
Figure 4 Example of cuts to a string “highway.”
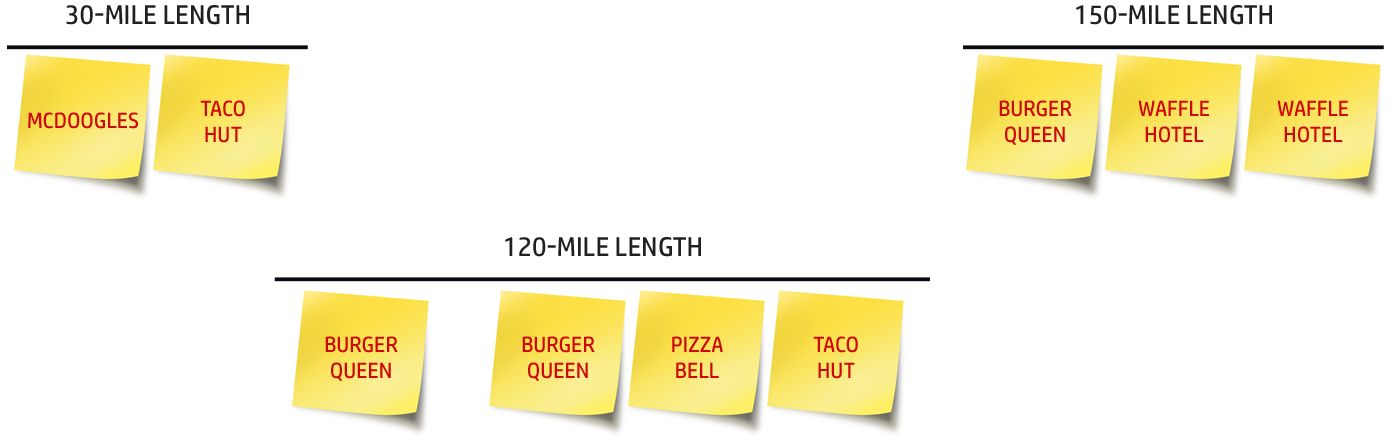
The cuts in the Fig. 4 example would produce the following 3 highway fragment lengths:
Length of String Fragment (in meters) |
Length of Fragment (in highway “miles”) |
|
|
|
|
|
|
|
|
|
|
|
|
|
|
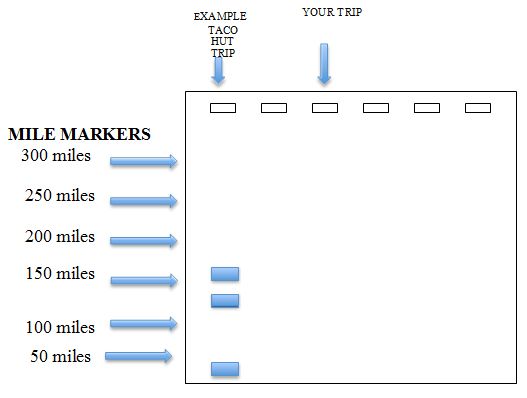
Figure 5 Distance map.